funneljoin
Emily Robinson has an awesome new package
funneljoin.
funneljoin has an intuitive interface to create and analyze funnels.
Be sure to check out her
vignette
and her slides:
Slides from my #rstatsdc talk on funneljoin are up! If you ever ask "first this then that" questions (e.g. "What % of people who visit this page buy something within 3 days" or "What was the last ad clicked before registering?"), check it out. https://t.co/zV7Fd9Juor pic.twitter.com/Dm4EH9MgiR
— Emily Robinson (@robinson_es) November 9, 2019
I’m so excited about Emily’s package,
because data analysts get requests for funnel charts all the time.
With funneljoin, you don’t have to start from scratch:
you can use your time and energy to understand the data,
rather than creating the funnel.
Customer usage funnels
In the funneljoin vignette, Emily uses ads as an example: she wants to find the proportion of users who buy something after they click an ad. I don’t work in ads, but customer usage funnels are also important for product design.
One theory is that customers purchase a product to do a job. Suppose we see some customers who purchase the product, but don’t use it.
We need to ask ourselves:
- is the platform making it difficult for them to do their job?
- do we understand the users’ job to be done?
Usage example
Let’s take a look at some simulated1 customer usage logs.
library(dplyr)
library(funneljoin)
library(purrr)
library(tidyr)
library(lubridate)
library(ggplot2)

set.seed(24)logs## # A tibble: 1,759 x 3
## date user event
## <date> <int> <chr>
## 1 2020-01-06 1 upload
## 2 2020-01-06 2 upload
## 3 2020-01-06 3 upload
## 4 2020-01-06 4 upload
## 5 2020-01-06 5 upload
## 6 2020-01-06 6 upload
## 7 2020-01-06 7 upload
## 8 2020-01-06 8 upload
## 9 2020-01-06 9 upload
## 10 2020-01-06 10 upload
## # … with 1,749 more rowsThis dataset records each time a user uploads, submits, or prints using the website.
Here’s the workflow. Customers
- upload data
- submit data to be analyzed
- print off reports based on the analysis
Additionally, here’s some assumptions about our customer.
- They purchase our product to print reports.
- Reports are only useful for data uploaded in the same week2.
Let’s use funneljoin to analyze our data set and see how many
customers are successfully printing reports on data they’ve uploaded.
I’ll make the funnel a function, since I’ll be reusing the same funnel through-out the blog post.
customer_funnel <- function(.data, type, max_gap = NULL) {
  .data %>%
    funnel_start(
      moment_type = "upload",
      moment = "event",
      tstamp = "date",
      user = "user"
    ) %>%
    funnel_steps(
      moment_types = c("submit", "print"),
      type = type,
      gap_col = TRUE,
      max_gap = max_gap
    ) %>%
    mutate(days_to_submit = .gap.x / 60 / 60 / 24) %>%
    mutate(days_to_print = .gap.y / 60 / 60 / 24)
}
logs %>%
customer_funnel("first-firstafter") %>%
summarize_funnel()## # A tibble: 3 x 4
## moment_type nb_step pct_cumulative pct_step
## <fct> <int> <dbl> <dbl>
## 1 upload 100 1 NA
## 2 submit 100 1 1
## 3 print 99 0.99 0.99At some point, almost all our our customers are submitting and printing uploaded data. But are they printing reports in time to be useful (before the end of the week)?
logs %>%
  customer_funnel("first-firstafter") %>%
  summarise(
    avg_days_to_submit = mean(days_to_submit, na.rm = TRUE),
    avg_days_to_print = mean(days_to_print, na.rm = TRUE),
    avg_time_to_complete_funnel = mean(
      days_to_submit + days_to_print,
      na.rm = TRUE
    )
  )
## # A tibble: 1 x 3
## avg_days_to_submit avg_days_to_print avg_time_to_complete_funnel
## <dbl> <dbl> <dbl>
## 1 4.03 5.37 9.42Something is definitely wrong. On average, customers are printing 9 days after uploading. This gap is too big: the data is out-of-date after 5-6 days and is no longer useful. What’s going on?
Are we using the right funnel type?
Funnel types
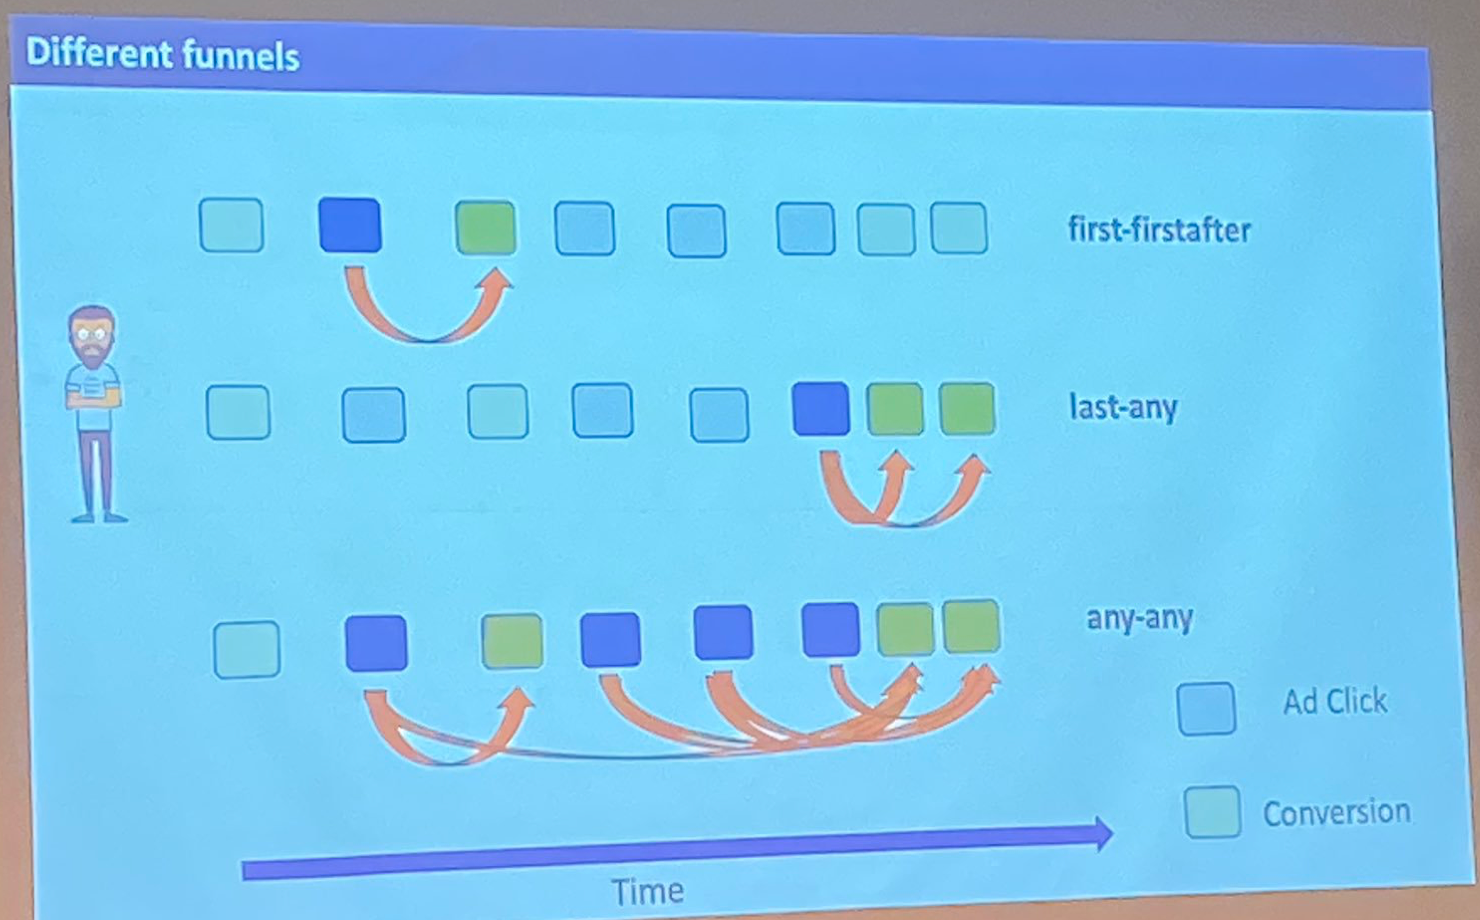
first-firstafter finds the first upload, and then the first submit
(then print) afterwards.
But this isn’t a safe assumption. Our customers are uploading throughout the month.
logs %>%
  filter(event == "upload") %>%
  mutate(week = floor_date(date, "week")) %>%
  group_by(week) %>%
  summarise(n = n()) %>%
  ggplot(aes(week, n)) +
  geom_line()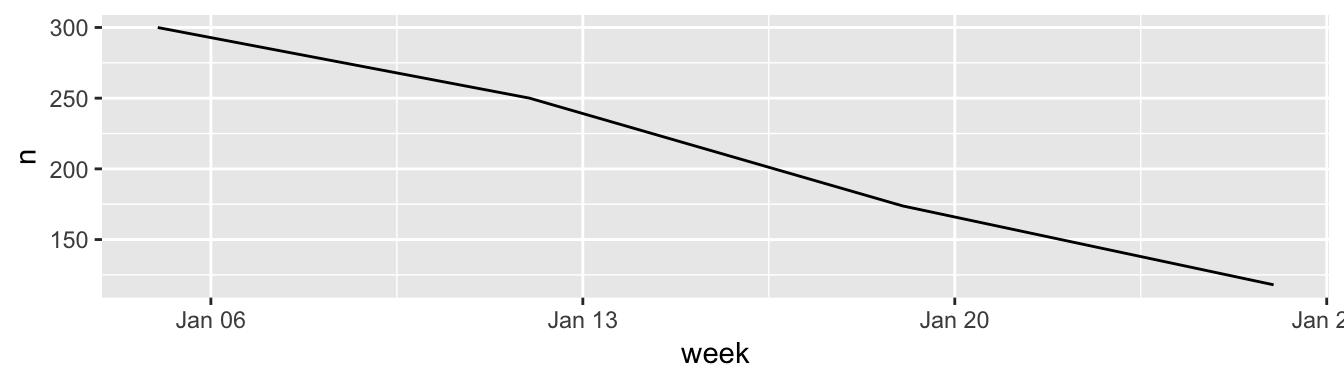
We care about each upload, not only the first one. We want to know if they are printing reports after any upload.
Enter any-firstafter. This will find the first
submit/print event after any user upload.
logs %>%
  customer_funnel("any-firstafter") %>%
  summarise(
    avg_days_to_submit = mean(days_to_submit, na.rm = TRUE),
    avg_days_to_print = mean(days_to_print, na.rm = TRUE),
    avg_time_to_complete_funnel = mean(
      days_to_submit + days_to_print,
      na.rm = TRUE
    )
  )
## # A tibble: 1 x 3
## avg_days_to_submit avg_days_to_print avg_time_to_complete_funnel
## <dbl> <dbl> <dbl>
## 1 2.84 3.80 6.64This looks better better for our customer. However they are still taking 6 days on average to complete the funnel. That’s right on the edge of being useless.
Gaps
One of our assumptions is that reports need to be printed in the
same week when the data was uploaded to be useful3.
Let’s add this assumption to our funnel, using the max_gap parameter.
weekly_customer_funnel <- logs %>%
  customer_funnel(
    "any-firstafter",
    max_gap = as.difftime(5, units = "days")
  )

weekly_customer_funnel %>%
  summarise(
    avg_days_to_submit = mean(days_to_submit, na.rm = TRUE),
    avg_days_to_print = mean(days_to_print, na.rm = TRUE),
    avg_time_to_complete_funnel = mean(
      days_to_submit + days_to_print,
      na.rm = TRUE
    )
  )
## # A tibble: 1 x 3
## avg_days_to_submit avg_days_to_print avg_time_to_complete_funnel
## <dbl> <dbl> <dbl>
## 1 1.93 2.04 3.96So for customers who print reports at most 5 days after uploading, on average they print reports about 4 days after uploading. This turnaround time is quick enough to be useful.
But this is only looking at users who print off reports. How many customers never print reports, even though they upload data?
Conversions
Let’s look at how many uploads lead to a print.
weekly_customer_funnel %>%
  summarize_funnel()
## # A tibble: 3 x 4
## moment_type nb_step pct_cumulative pct_step
## <fct> <int> <dbl> <dbl>
## 1 upload 842 1 NA
## 2 submit 749 0.890 0.890
## 3 print 584 0.694 0.780Around 30% of data uploaded isn’t printed off as a report. What’s going on? Let’s look at the trend over time.
This is a little messy, but the goal is to calculate the conversation rate by week of upload.
weekly_customer_funnel %>%
  mutate(upload_week = floor_date(date_upload, "week")) %>%
  nest(funnel = -upload_week) %>%
  mutate(funnel = map(funnel, summarize_conversions, date_print)) %>%
  unnest(funnel) %>%
  arrange(upload_week)
## # A tibble: 4 x 4
## upload_week nb_users nb_conversions pct_converted
## <date> <int> <int> <dbl>
## 1 2020-01-05 300 132 0.44
## 2 2020-01-12 250 184 0.736
## 3 2020-01-19 174 150 0.862
## 4 2020-01-26 118 118 1Early in the month, our users print reports much less often. But by the end of the month, reports always follow within 5 days of an upload.
Maybe there isn’t a problem with the platform, but there is additional seasonality we need to understand.
Conclusion
I absolutely love this package. In my experience, business partners love funnel plots and dashboards. The fact that this package provides a systematic interface to cleaning and analyzing this type of data will save me time and brainpower.
Definitely check it out the next time you need to create a funnel!
If you want to see how I simulated this data, checkout out the source for this blog post here: https://github.com/tmastny/website2/blob/master/content/blog/2019-11-08-funneljoin.Rmd↩
For example, football coaches need scouting reports to prepare for their next opponent. Next week is too late, because they’ve already played them and they have to prepare for the next game.↩
Technically our assumption was slightly different. Printing 5 days after the upload may still be too late. The real constraint is that the print must occur in the same calender week as the upload. This adds some complications, so in this blog post I’ve stuck with gaps. But check out my gap vs. deadline blog post for a full analysis.↩